Rip Curl Virtual Pro

Visualisation of Surf Data

Spanning across 7 continents, 10 days and over 1,600 surfers, the world’s first virtual surfing competition, the Rip Curl Virtual Pro, launched via Tourism Fiji and VMLY&R.

EyeJack was entrusted with crafting a generative data visualisation and a bespoke campaign website, allowing each surfer to delve deep into their data and explore their individual performance insights.

Data Visualisation

Lorem ipsum dolor sit amet, consectetur adipiscing elit. Duis mollis blandit augue, ut aliquet quam ornare a. Vestibulum suscipit, urna eu aliquet sagittis, lectus arcu egestas purus, vel convallis justo elit et mi. Nullam non iaculis felis. Donec rutrum lorem tortor, vel consequat sem varius vitae. Vivamus id metus convallis,

Pellentesque habitant morbi tristique senectus et netus et malesuada fames ac turpis egestas. Maecenas accumsan leo ex, sit amet porta sem semper suscipit. In mi ipsum, iaculis in purus commodo, rhoncus luctus odio. Pellentesque id lacus dignissim, vestibulum felis eget, fermentum magna. Vivamus ac lacus sit amet urna lobortis commodo id ac odio.

www.websitelink.com
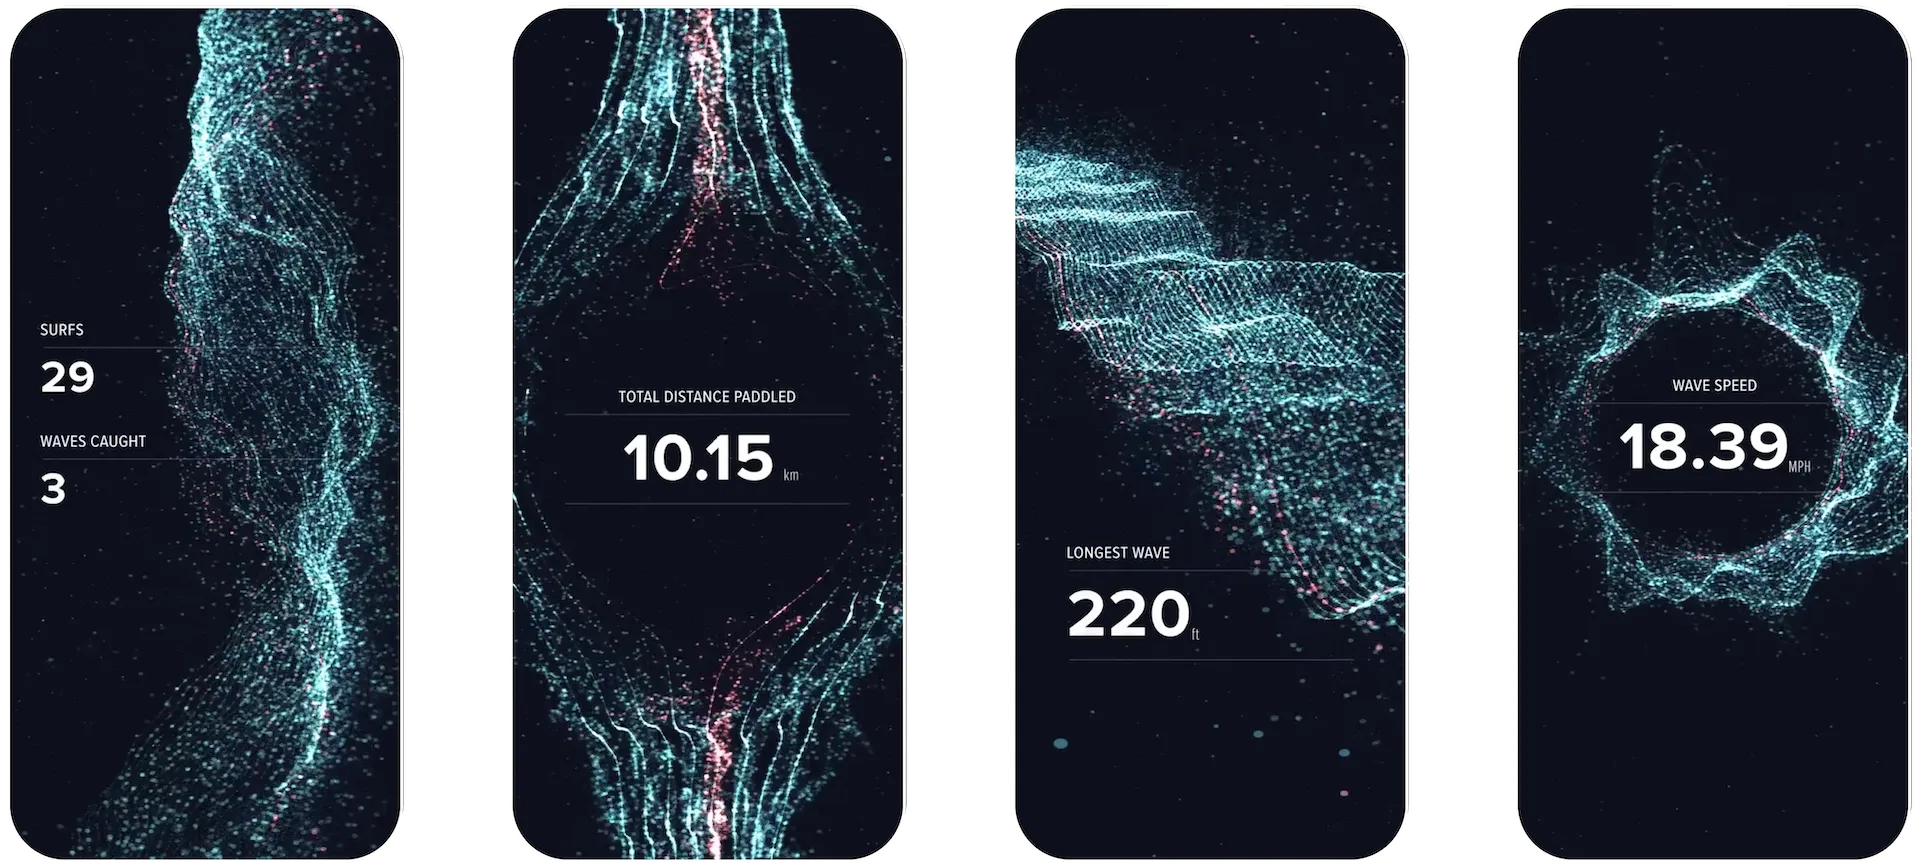
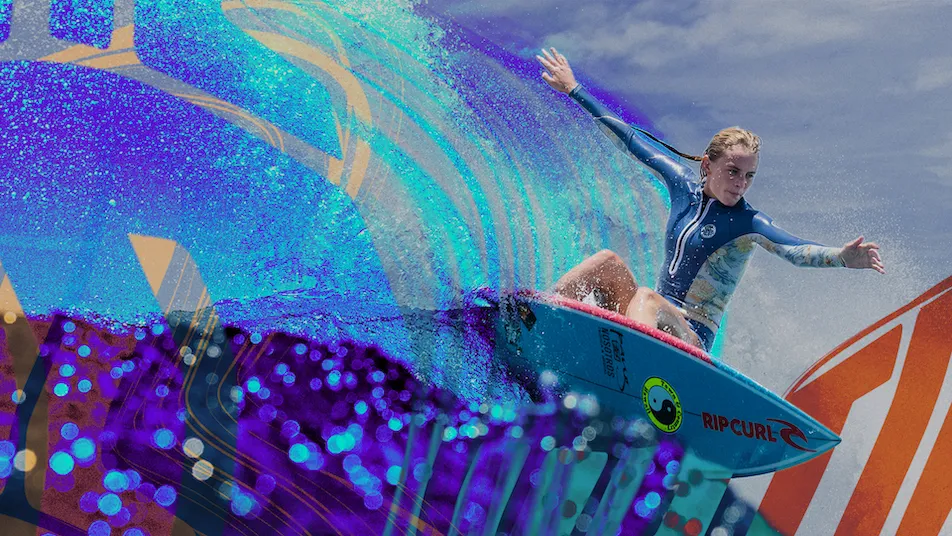
The artistic direction of the data visualisation focused on the use of lines and drew inspiration from the ocean, tides, and waves. Combined with the use of ocean mist particles, our bespoke compute shader system rendered 4 million particles at a brisk 60 fps.
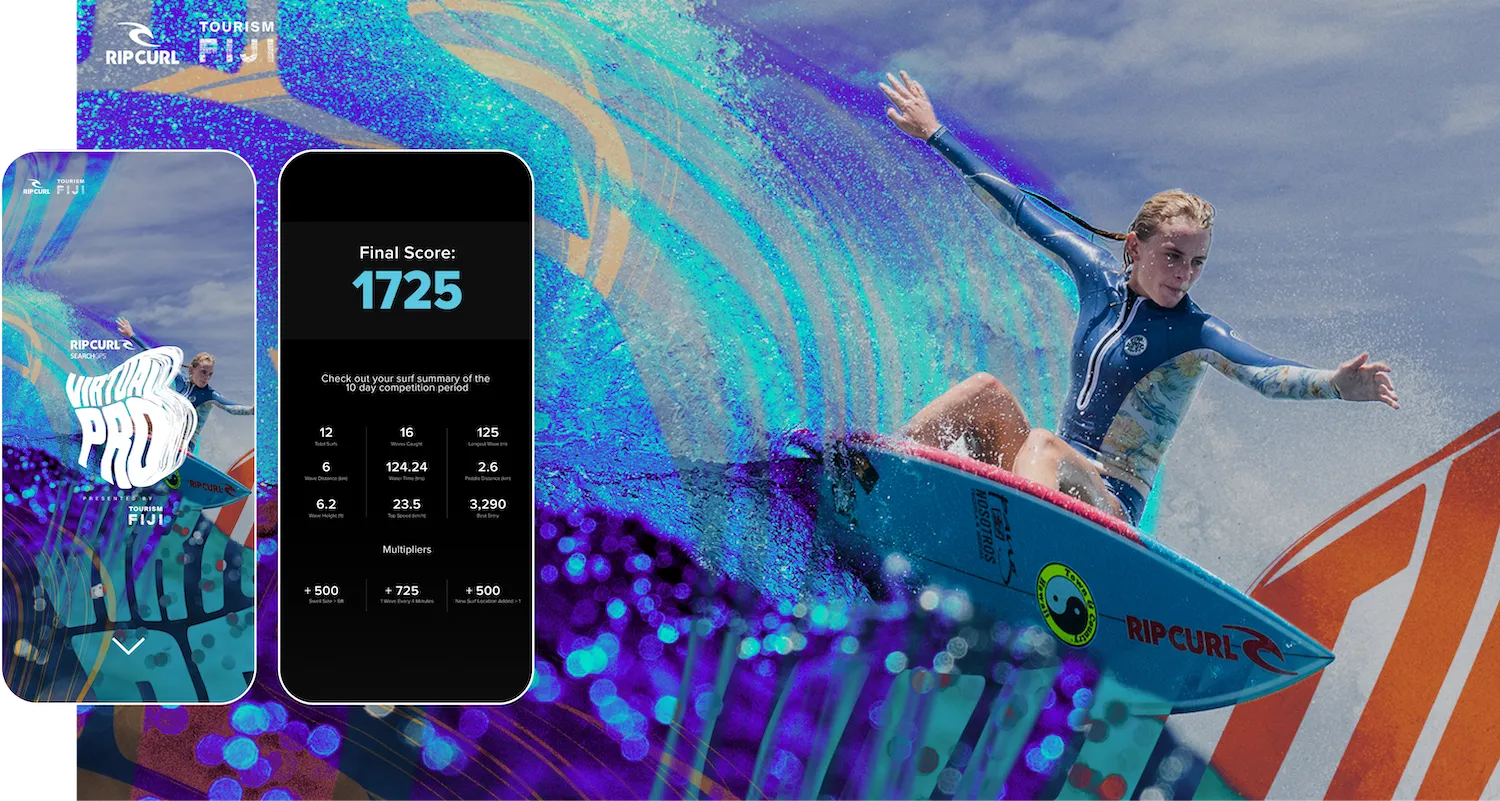
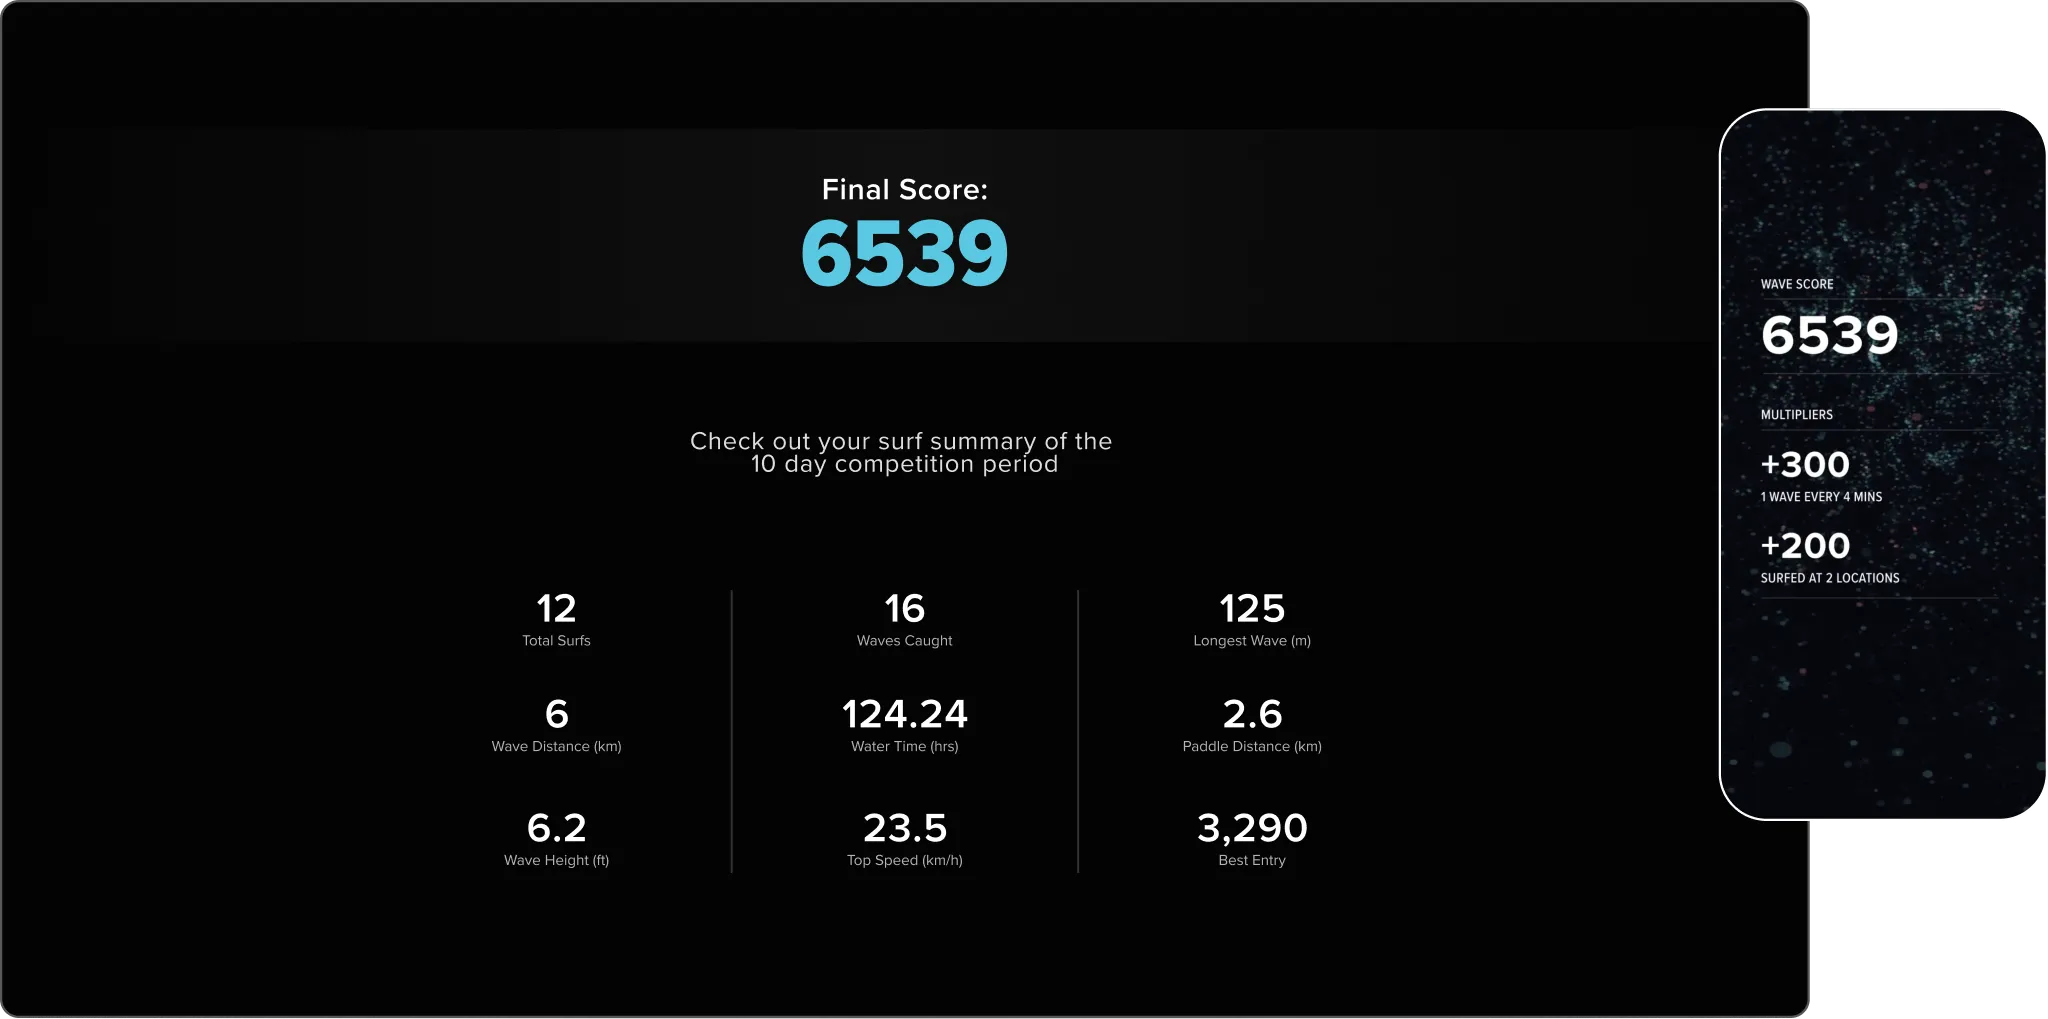
Each line in the visualisation depicts a surfing session, with the standout session highlighted in red. The design incentives frequent surfers, enriching the visual complexity as more data was accumulated from their watch during the competition.
Lorem ipsum dolor sit amet, consectetur adipiscing elit. Duis mollis blandit augue, ut aliquet quam ornare a. Vestibulum suscipit, urna eu aliquet sagittis, lectus arcu egestas purus, vel convallis justo elit et mi. Nullam non iaculis felis. Donec rutrum lorem tortor, vel consequat sem varius vitae. Vivamus id metus convallis,

Pellentesque habitant morbi tristique senectus et netus et malesuada fames ac turpis egestas. Maecenas accumsan leo ex, sit amet porta sem semper suscipit. In mi ipsum, iaculis in purus commodo, rhoncus luctus odio. Pellentesque id lacus dignissim, vestibulum felis eget, fermentum magna. Vivamus ac lacus sit amet urna lobortis commodo id ac odio.

www.websitelink.com
The Data Visualisation was crafted using our custom generative tools. These tools assimilate surf data and instantly produce a visualisation of the surfs using Three.js and Electron, offering real-time VFX!
Over 1,600 videos were generated and delivered to Rip Curl surfers. With a cumulative render time exceeding 300 hours (equivalent to 2 weeks). We engineered a custom cloud rendering solution to streamline the process and ensure the videos could be delivered in a fraction of the time.
Lorem ipsum dolor sit amet, consectetur adipiscing elit. Duis mollis blandit augue, ut aliquet quam ornare a. Vestibulum suscipit, urna eu aliquet sagittis, lectus arcu egestas purus, vel convallis justo elit et mi. Nullam non iaculis felis. Donec rutrum lorem tortor, vel consequat sem varius vitae. Vivamus id metus convallis,

Pellentesque habitant morbi tristique senectus et netus et malesuada fames ac turpis egestas. Maecenas accumsan leo ex, sit amet porta sem semper suscipit. In mi ipsum, iaculis in purus commodo, rhoncus luctus odio. Pellentesque id lacus dignissim, vestibulum felis eget, fermentum magna. Vivamus ac lacus sit amet urna lobortis commodo id ac odio.

www.websitelink.com
The final score was calculated from the aggregation of individual data points. Score multipliers were used to motivate surfers to spend more time in the water. The emphasis was on dedication rather than purely on surfing prowess.

Microsite

At EyeJack, we pride ourselves on attention to detail. Alongside the sleek microsite that we crafted, we also delved into the intricacies of the logo motion design. All of this was achieved while closely collaborating with VMLY&R, ensuring that our design and development choices complemented their overarching vision. It was a seamless fusion of creative vision and adept execution.

Enquire Now